Yellowstone Lake (Figure 1) is the largest high-altitude lake in North America with an altitude of 2,357 m (7,731 ft) and a surface area of 341 km2 (Figure 1, inset). More than 141 rivers and streams flow into the lake. The Yellowstone River, which enters at the south end of the Southeast Arm, dominates the inflow of water and sediment. The only outlet from the lake is at Fishing Bridge where the Yellowstone River flows north and discharges 375-4600 cfs (http://nwis.waterdata.usgs.gov).
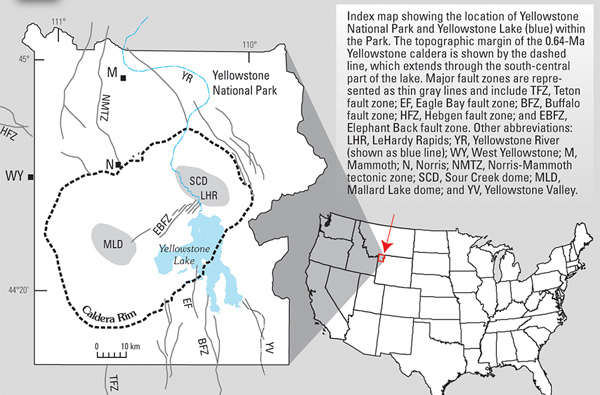
Figure 1. Yellowstone Lake
Yellowstone Lake played a major role in the exploration of the Rocky Mountain west and was believed at the time to be the headwaters for two of three major river systems (Missouri and Snake Rivers) in the intermountain west. The first non-Indian explorer into Yellowstone was John Colter entering from the south along the Snake River. Continuing northward, Colter proceeded by a large lake on its western side and then north along the Yellowstone River. The description of this trip was translated into a crude, but first, map of Yellowstone Lake, then referred to as Eustis Lake, and included in the 1813 Clark Manuscript Map and the 1814 Lewis and Clark Map. Other iterations of maps depicting Yellowstone Lake (also known as Subletts/Soublets Lake) are in later maps.
The earliest attempt to produce a detailed map of the shoreline and bathymetry of Yellowstone Lake was during the 1871 U.S. Geological Survey (USGS) expedition. Ferdinand V. Hayden led 28 scientists, scouts, and cooks in a survey of what is now known as Yellowstone National Park (Merrill, 1999). The sheer effort expended by this group in the most primitive of working conditions in tandem with the many accomplishments of the survey is impressive. A primary goal of the 1871 Hayden party was “***mak(ing) a most thorough survey of it [Yellowstone Lake]” (F.V. Hayden, letter of June 4, 1871, to Professor Spencer Fullerton Baird, in Merrill, 1999) and reflects Hayden’s general interest in watersheds and river drainage basins (M.D. Merrill, written commun., 2002). A 4.5-ft by 11-ft oak boat with a woolen-blanket sail (A. Peale, July 28, 1871, in Merrill, 1999) was used to map Yellowstone Lake. Mapping took 24 days and included approximately 300 lead-sink soundings (Figure 2).
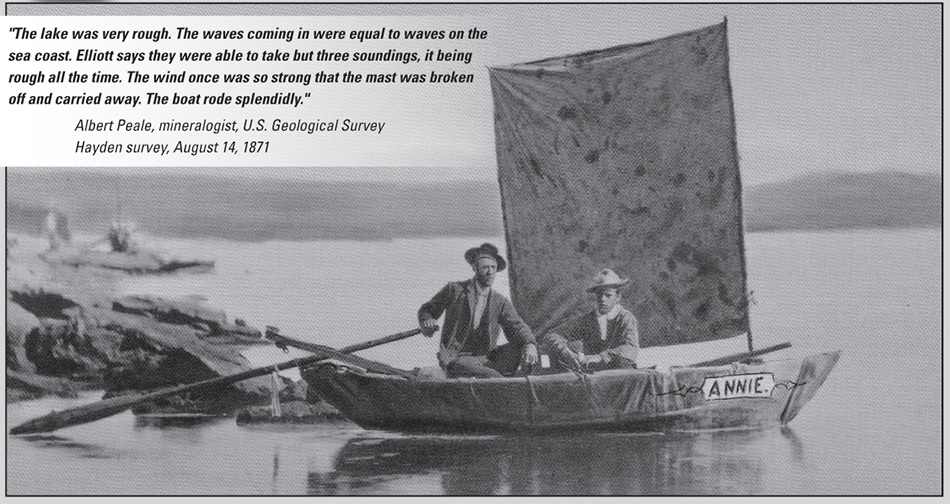
Figure 2. Survey boat, The Annie, with James Stevenson (left) and Chester Dawes on July 28, 1871. Photo taken by W.H. Jackson.
Navigation was carried out using a prismatic compass. As Albert Peale (Merrill, 1999) described in his journal, “a man stands on the shore with a compass and takes a bearing to the man in the Boat as he drops the lead, giving a signal at the time. Then the man in the Boat takes a bearing to the fixed point on the shore where the first man is located and thus the soundings will be located on the chart**** [Elliott will] make a systematic sketch of the shore with all its indentations [from?] the banks down, indeed, making a complete topographical as well as a pictorial sketch of the shores as seen from the water, for a circuit of at least 130 mi. He will also make soundings, at various points.” (A. Peale, July 1871, in Merrill, 1999). The survey mapped a shoreline of 130 mi; the most recently mapped shoreline gives the perimeter of Yellowstone Lake to be 136.3 mi. More than 40 soundings were taken along the north and west shores in the Hayden survey, the deepest being around 300 ft. The survey estimated the deepest part of the lake would be farther east and no deeper than 500 ft (Merrill, 1999). This depth range is comparable to what we know today; the deepest point in Yellowstone Lake is due east of Stevenson Island at 430 ft deep (Kaplinski, 1991; Morgan et al., 2003, 2007a, 2007b). In addition, the Hayden survey identified the long northeast-trending trough crossing the central basin. Figure 3 shows the map of Yellowstone Lake as drawn by Henry Elliott of the Hayden survey (personal communication, Marlene Merrill, 2000). The map not only shows a detailed topographical sketch of the Yellowstone Lake shoreline, but many of the points where soundings were taken for the survey.
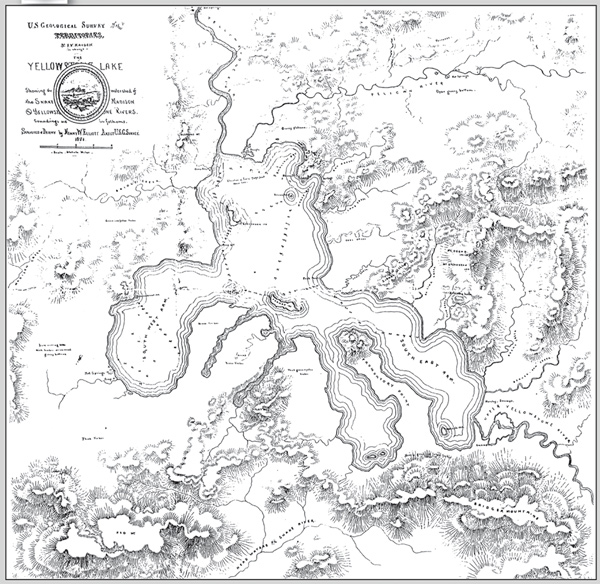
Figure 3. Henry Elliott’s 1871 map of Yellowstone Lake (obtained from Marlene Merrill, written commun., 2003). The headwaters of the Snake River, Upper Valley of the Yellowstone River, and Pelican River are shown. The area now known as West Thumb is referred to as the South West Arm on the map. About 300 lead-sink soundings of lake depth were taken in this survey; most locations where soundings were obtained are marked on this map (depth in feet). Also shown are several of the places where the Hayden survey camped as they traversed around Yellowstone Lake.
A second map of Yellowstone Lake incorporated elements of the original 1871 Elliott map from the Hayden expedition and was published in 1896. Even though no mention is made in the official U.S. Geological Survey report (Hague, 1896) of additional mapping or modifications made to the Elliott Yellowstone Lake map during the years of the Hague survey (1883–89, 1890–91, and 1893), clearly the lake was resurveyed and triangulated by H.S. Chase and others—this information is shown on maps in the Hague report. The 1896 map built upon the Elliott map and refined areas on the shoreline, such as in the Delusion Lake area between Flat Mountain Arm and Breeze Point. Where the Elliott map of Yellowstone Lake shows Delusion Lake as an arm of the lake, the Hague map delineates the boundaries of Delusion Lake and identifies swampy areas nearby. The maps from the Hague survey of Yellowstone National Park also include a rather sophisticated geologic map of portions of the park around the lake.
The next significant attempts to map Yellowstone Lake came a hundred years later in a series of bathymetric maps (U.S Fish and Wildlife/NPS bathymetry maps of Yellowstone Lake, 1950-70; Otis and others, 1977; Kaplinski, 1991). Kaplinski (1991) employed a single-channel echo sounder and a mini-ranger for navigation requiring interpolation between track lines. More than 1,475 km of sonar profiles were collected in 1987 using track lines spaced approximately 500 m apart and connected by cross lines spaced 1 to 2 km apart. An additional 1,150 km of sonar profiles was collected in 1988 to fill in data gaps from the 1987 survey. The map identified many thermal areas on the floor of the lake. The bathymetric map produced by Kaplinski (1991) (Figure 3) has served as the most accurate lake map for Yellowstone National Park for more than a decade and has proven invaluable in addressing serious resource-management issues, specifically monitoring and catching the aggressive and piscivorous lake trout. The lake trout is estimated to consume as many as 60 native Yellowstone Lake cutthroat trout per year (Ruzycki and Beauchamp, 1997).
Ten years after the Kaplinski (1991) bathymetric map, development of global-positioning technology and high-resolution multi-beam sonar imaging justified a new, high-resolution mapping effort of the lake. Mapping and sampling conducted in 1999 through 2002 as a collaborative effort between the U.S. Geological Survey, Eastern Oceanics, Inc., and the National Park Service (NPS) (Yellowstone National Park) utilized state-of-the-art swath sonar (126 beams) bathymetry, seismic reflection, and submersible remotely operated vehicle (ROV) equipment to collect data along 200-m track lines with later infill, where necessary. The 1999–2002 mapping effort of Yellowstone Lake took 62 days during a 4-year period—compared to Hayden’s survey of 24 days in 1871—and began in 1999 with mapping the northern basin, continued in 2000 in West Thumb basin, in 2001 in the central basin, and in 2002 in the southern part of the lake including the Flat Mountain, South, and Southeast Arms (Figure 4). A 700 sq m area, informally referred to as the “north basin hydrothermal dome”, first identified in the 1999 survey was resurveyed in 2002. In 2003, seismic-reflection profiles were collected in the South and Southeast Arms. Unlike any of the previous mapping efforts of Yellowstone Lake, the 1999–2002 swath, multi-beam survey produced continuous overlapping coverage and collected more than 240 million soundings producing high-resolution bathymetric images. Seismic-reflection records of the upper 25 m of the lake bottom were obtained along with the bathymetry of the entire lake. This effort resulted in a map that is accurate to less than 1 m in most areas.
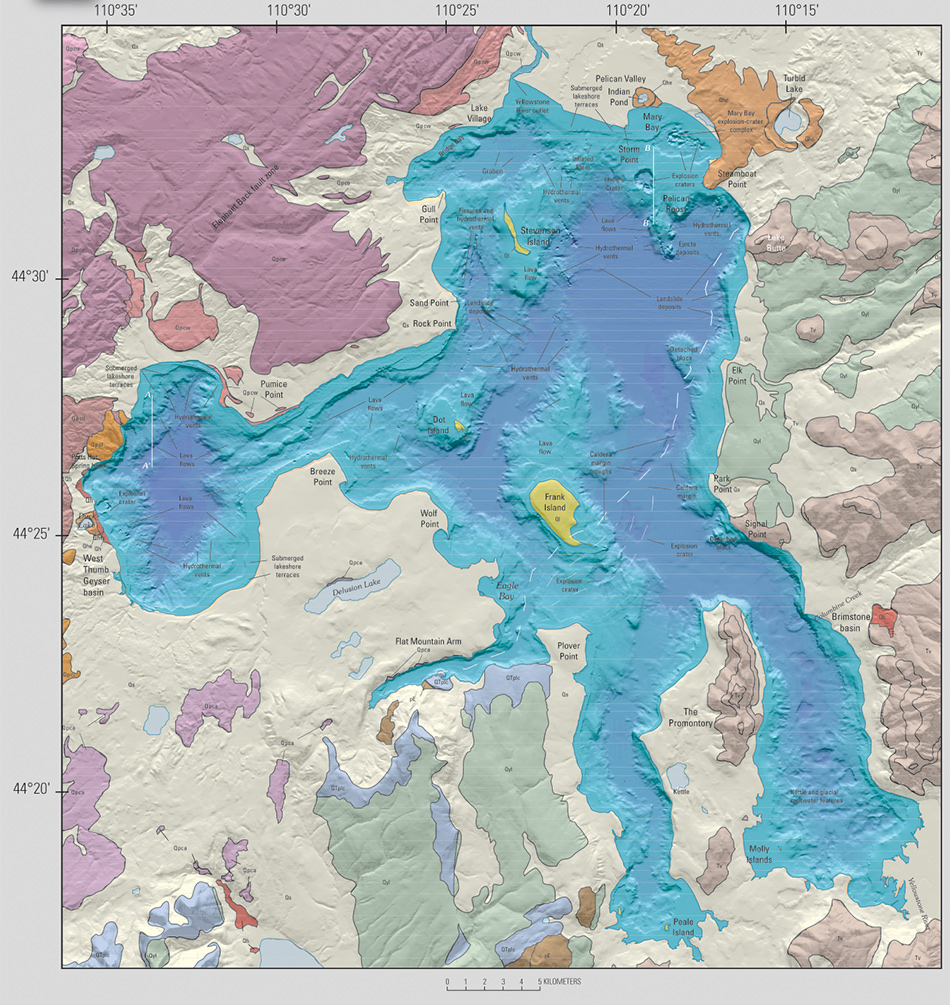
Figure 4. New high-resolution bathymetric map shown as blue-shaded-relief map of Yellowstone Lake, acquired by multibeam-sonar imaging, surrounded by a colored geologic map of the area around Yellowstone Lake (U.S. Geological Survey, 1972). The new map of the lake shows previously unknown features, such as an ~550-m-wide hydrothermal-explosion crater (east of Duck Lake); a 700-m-wide explosion crater south of Frank Island; and numerous hydrothermal vents, fissures, submerged lakeshore terraces, landslide deposits, and rhyolitic lava flows that underlie 7 to 10m of postgla-cial sediments in West Thumb basin (Morgan and others, 2003; Johnson and others, 2003; Otis and others, 1977). In the northern basin, large hydrothermal-explosion craters in Mary Bay and south-southeast of Storm Point, numerous smaller craters related to hydrothermal vents, landslide deposits along the eastern margin of the lake near the caldera margin (fig. 1), and postcaldera rhyolitic lava flows shape the lake basin. Glacial deposits (not shown in the northern basin in order to emphasize the postcaldera rhyolitic lava flows) are present throughoutthe lake and mantle the lava flows. Fissures west of Stevenson Island and the graben north of Stevenson Island may be related to extension along the young Eagle Bay fault.
In 2012, scientists from the University of Illinois joined with LA Morgan and WC Shanks of the US Geological Survey and deployed a high-resolution MBES (multi-beam echo sounder) to produce a bathymetric map of Lewis Lake and selected features in the northern basin of Yellowstone Lake, including the deep hole east of Stevenson Island (the target area in the 2016-2017 DYLake experiment), Elliott’s Crater hydrothermal complex, the north basin hydrothermal dome, and the siliceous spires. Over 2 billion data points were collected in the surveys and produced resulted in maps accurate to less than 10 cm.
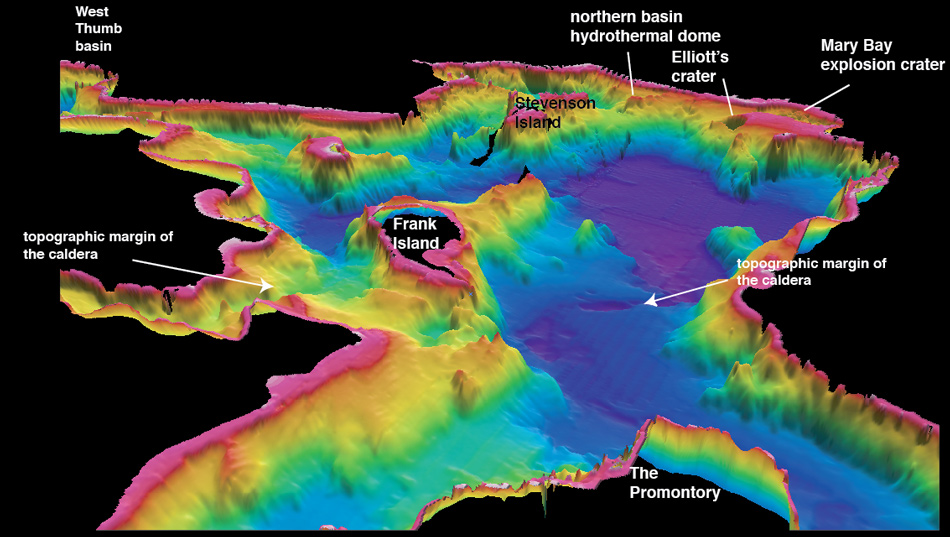
Figure 5. Oblique bathymetric image of Yellowstone Lake viewed from the Promontory northward into the 640,000-year-old Yellowstone caldera.
Modified from Morgan et al., 2007